Linear Scheduling 101
How to create your most-valuable project management tool on a single page.
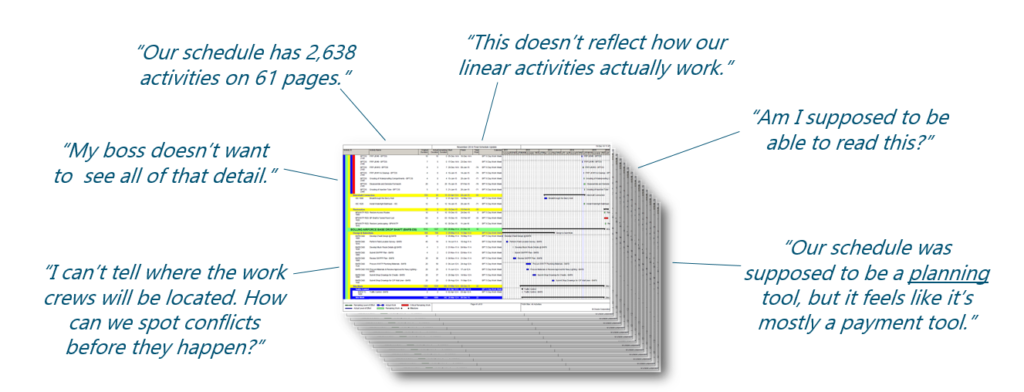
The problem with Gantt charts on major projects:

We’ve been there. Major projects is what we do.
This guide was created by two construction managers who needed a better way to communicate complex schedules with their project teams. We live and breathe this stuff every day.
James Wonneberg, PE, CCM
Construction management of major projects since 2008, including:
- 2008-2011: Brightwater Conveyance Project (Woodinville, WA)
- 2011-2016: DC Clean Rivers Project (District of Columbia)
- 2016-2019: Alaskan Way Viaduct Replacement Program (Seattle, WA)
- 2019-Present: I-405 Widening & Express Toll Lanes Project (Bellevue, WA)
Pioneered the use of dynamic Excel graphics that redraw themselves automatically with links to contractors’ Primavera P6 schedules.

Ron Drake, PE
Leading complex infrastructure projects for 40+ years, including:
- 1990-1993: Metro Red Line (Los Angeles, CA)
- 1993-1998: Tri-Met Westside Light Rail (Portland, OR)
- 2005-2007: Brightwater Conveyance Project (Woodinville, WA)
- 2014-2019: LA Metro Regional Connector (Los Angeles, CA)
- 2019-Present: PM/CM Practice Lead
Has made linear scheduling a cornerstone of his project management approach for decades.

What We Believe:
We believe that the vast majority of people that work on these projects really do want to know what’s in that huge schedule with thousands of activities.
They want to know the master plan. They want to see the big picture and understand the relationships between activities. They want to know about the deadlines that their crew must meet. But our industry lacks the tools to communicate that information in a way that the entire team can understand.
We believe that if you make your schedule beautiful, your team will use it!
If you place a good-looking linear schedule on the table in any project office or jobsite trailer, people will go out of their way to look at it, pick it up, and study it. Then they will ask questions, and give you valuable feedback about how the work will actually be built.
(But if you don’t make your schedule beautiful, it will be ignored and forgotten like all the rest.)
We believe that schedules should fit on one page.
The moment you have to flip the page to see the rest of your sequence of work, you’ve lost the relationships between activities. This is not to say that we don’t create multiple sheets; in fact we do it all the time to “zoom in” and “zoom out” on our projects. But each sheet should tell the whole story of what you are trying to communicate.
We believe that adding a simple graphic of what you’re building makes your schedule information 10x more useful and effective.
Most people are visual learners, and schedule data doesn’t sink in unless they can visualize the major work elements and the spatial relationships between them. A one-page illustration of scope of work and schedule becomes a very useful “talking paper” that helps you quickly explain your entire project to anyone, anywhere. And your team members will undoubtedly start sketching right on top of it for all sorts of problem solving, alternatives, and what-if-scenarios. This is when the magic happens – increasing the chances of your team delivering a winning project.
What the Industry is Saying:
“As engineers and contractors, we are taught to break down complex projects into fundamental simpler pieces. Linear schedules are great tools that help us break down complex P6 schedules to help communicate to all team members our plan for success.”
-Fernando De Leon, Project Director at Shimmick Construction
“The linear scheduling method really helps to visualize a project’s schedule. It makes it possible to not only account for time but also space constraints.”
-Lisa Mori, Tunnel Engineer at Jay Dee Contractors
This guide will walk you through the fundamentals of a linear schedule, give you the vision for how it can be applied, and show you how to put it to work as your project evolves. Along the way you’ll hear from more industry leaders about how they’re using linear scheduling to execute their own challenging projects.


