1. The Basics
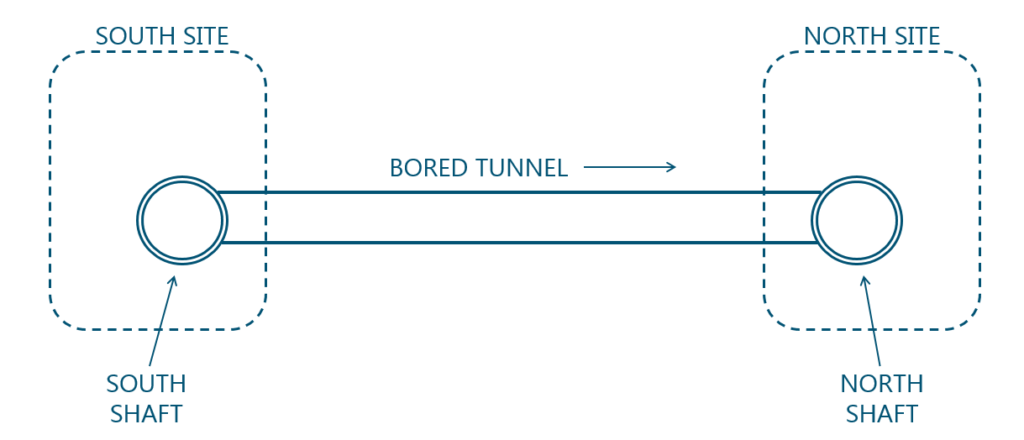
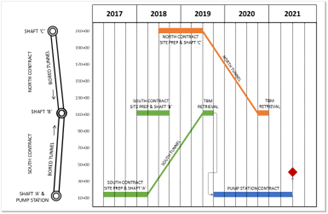
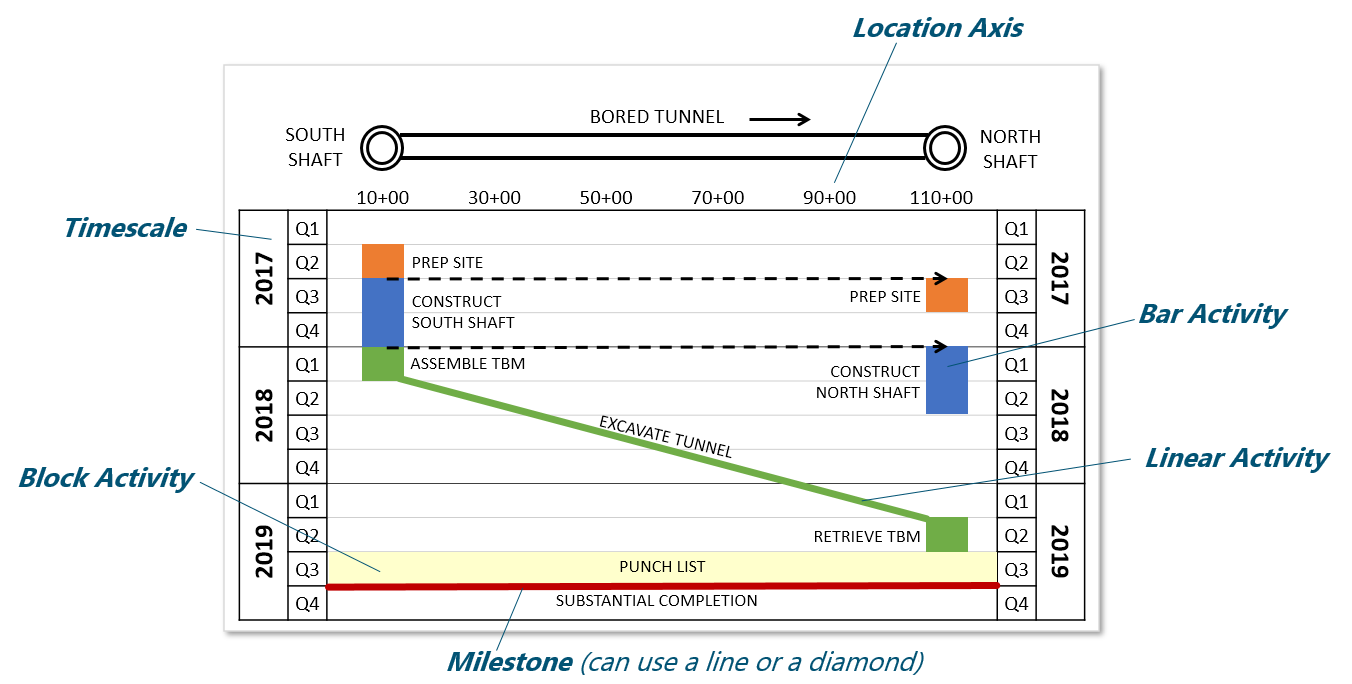
Tunnel Project Example:
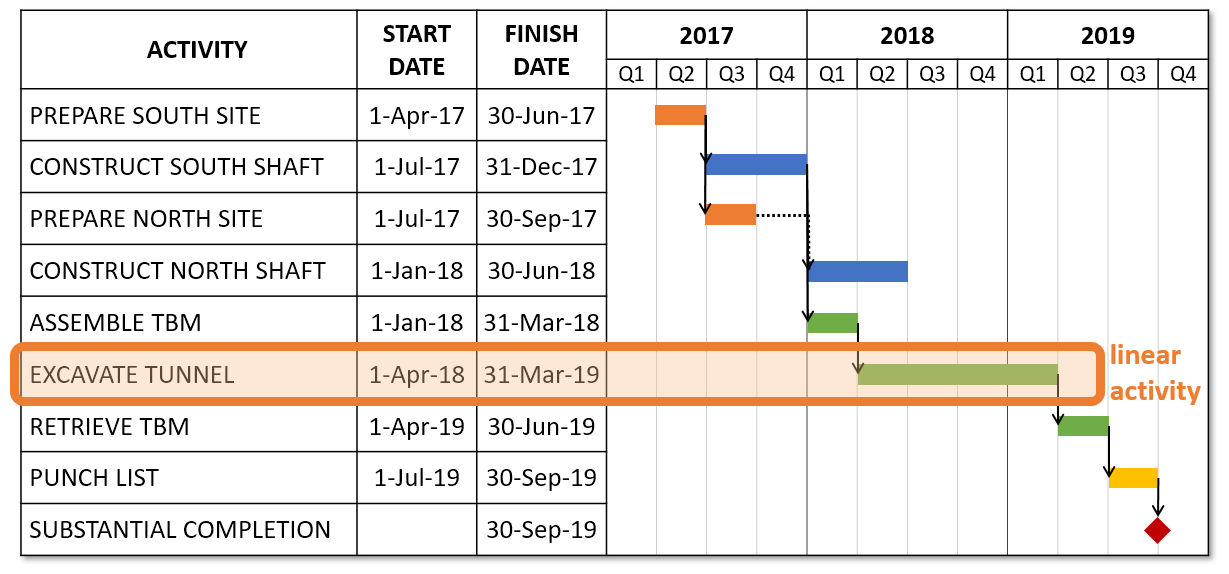
Simplified Gantt Chart:
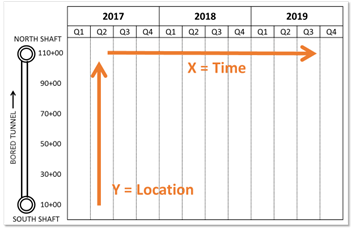
Page Setup for Linear Schedule:
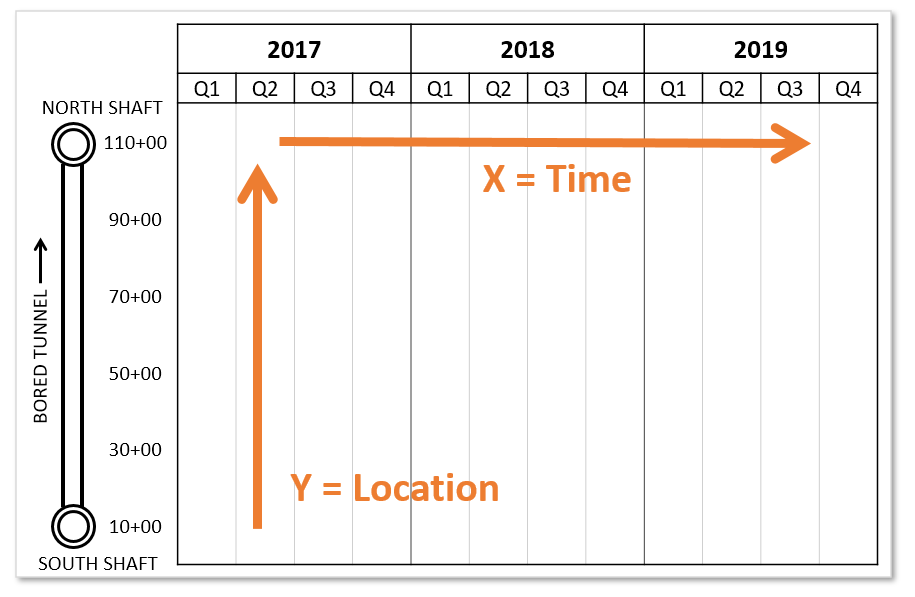
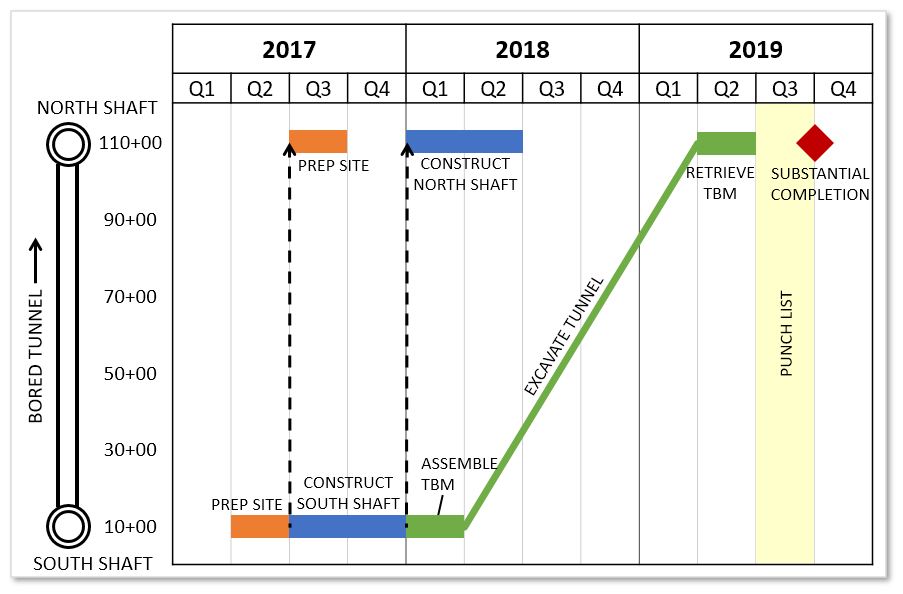
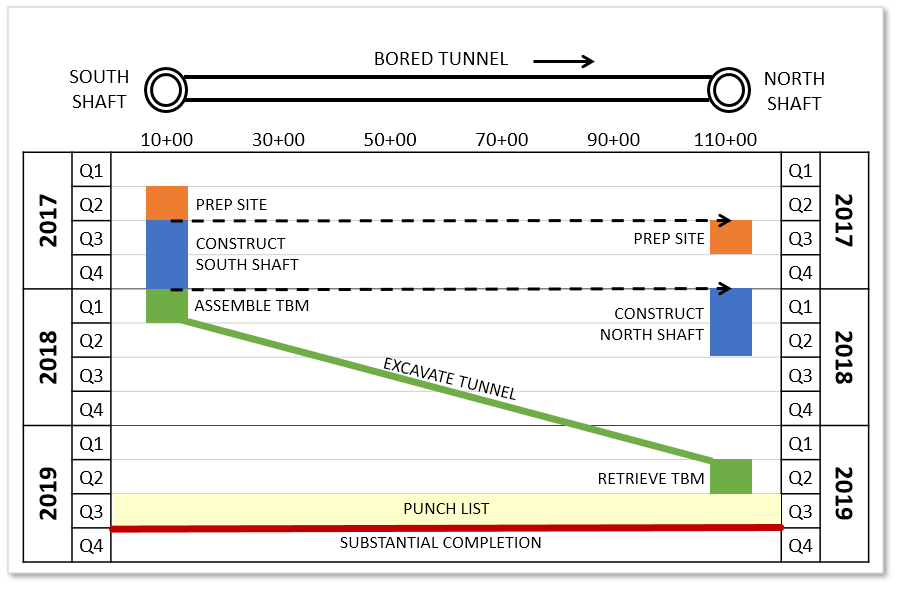
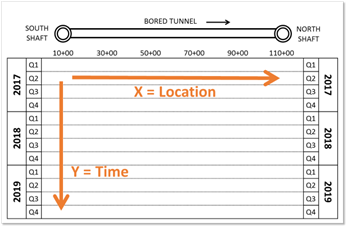
Linear Schedule:
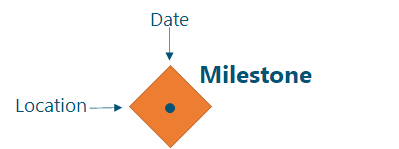
Terminology:
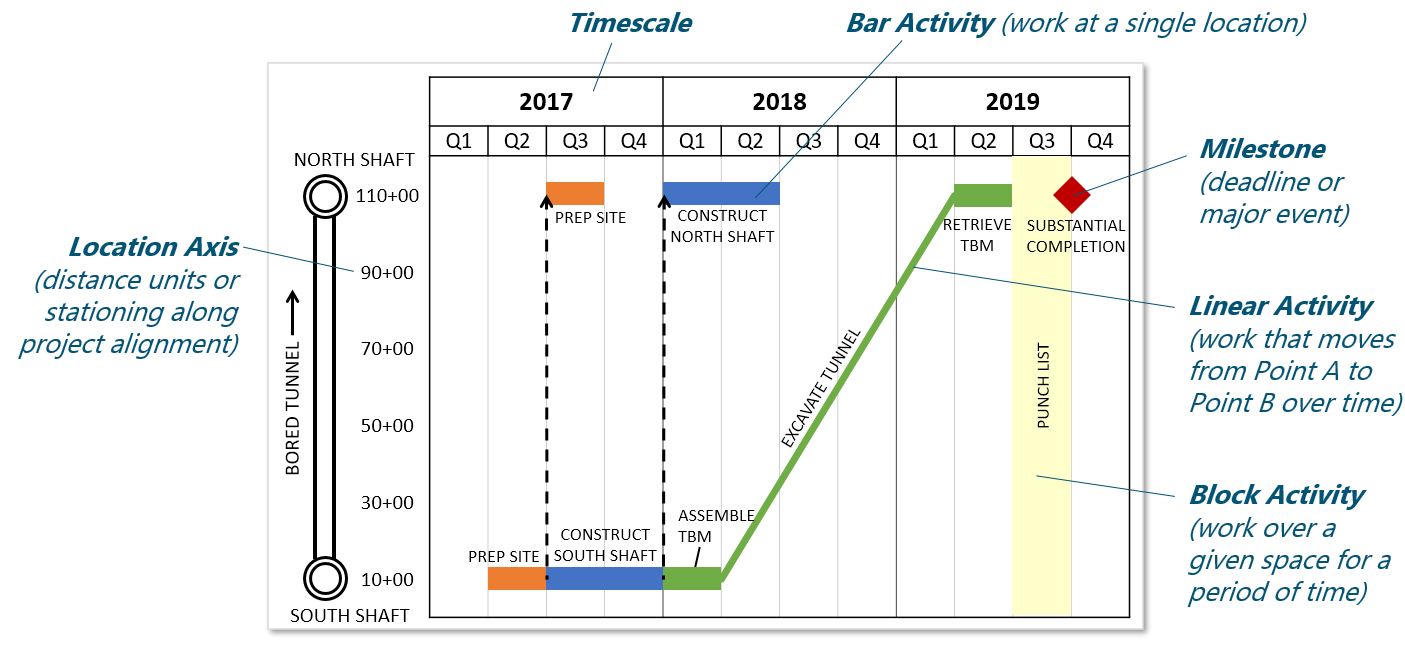
Primary Types of Activities:
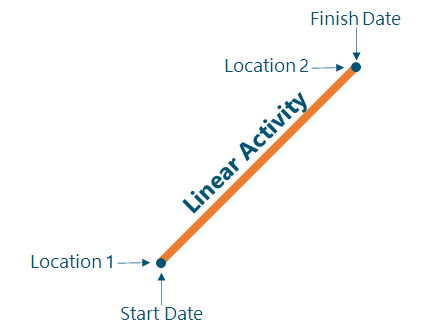
1. Work that moves from Point A to Point B over time
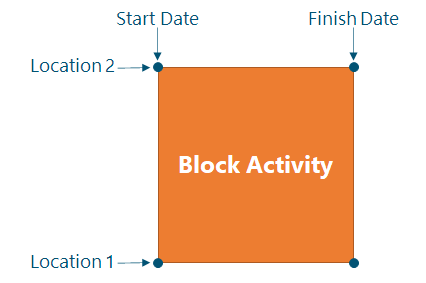
2. Work over a given space for a period of time
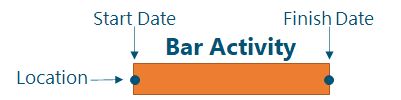
3. Work at a single location
4. Deadline or major event
What do the colors mean?
Short Answer:
Whatever you like.
Better Answer:
We usually assign one color to each major type of work (similar to layers in a CADD drawing). This makes it easy to see how your crews and equipment will move through the project over time.
Or, when illustrating a large program with multiple contracts, we often assign one color to each contract. This helps everyone see how all of the contracts work together to complete the program. It also highlights the interfaces (i.e. touch points) that will require coordination to make sure everything goes smoothly.
Color is a good thing. Be creative, and don’t hold back!

or
Advantages of a Linear Schedule

“Are we OK with three cranes or do we need to add a fourth? I can just look down a specific month on the linear schedule and see right away how many crews or spreads we will have working and at what locations. All on one page. That is convenient compared to long P6 schedules.”
-Brett Zernich, Project Manager at Traylor Bros.

“The linear schedule update is one email that I actually look forward to receiving each month. It provides a concise and useful snapshot of otherwise complex project and program schedules.”
-Rafael Castro, Principal at JCK Underground

“Linear schedules have been essential to communicating inter-project and inter-agency construction relationships.”
-Brian Smith, Program Controls Manager at Mott MacDonald
Alternate Page Setup: Time on Vertical Axis
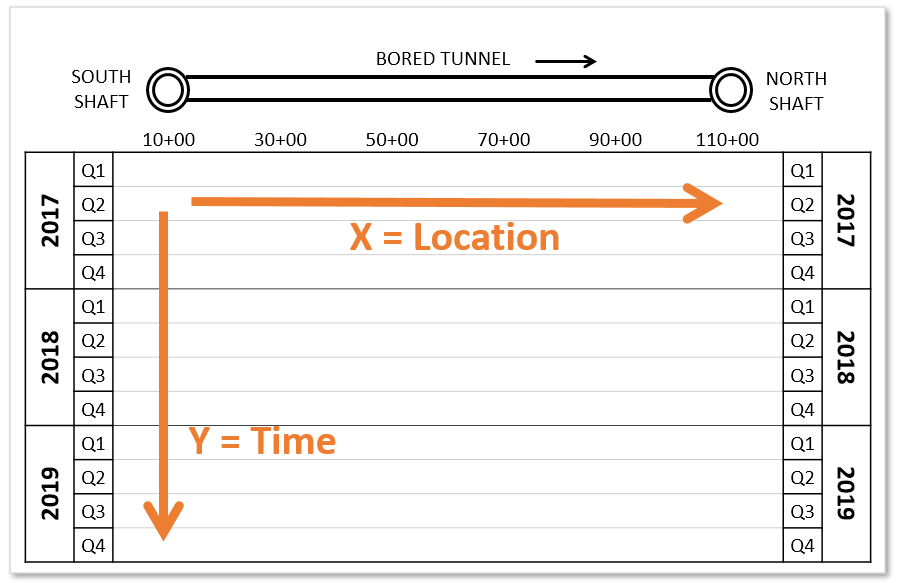
Linear Schedule: Time on Vertical Axis
Same Terminology
Time from Left to Right
- Easiest to read for general audiences (the way we normally read schedules)
- Expanded timescale accommodates more-detailed schedule activities and labels
- Differences in linear production rates are more obvious
Time on Vertical Axis
Also called a Time-Chainage Diagram
- Keeps the drawing horizontal (the way we normally read plan & profile drawings)
- Can illustrate the sequence in the same direction that the work is constructed (i.e. top-down or bottom-up)
Which format to choose? Here’s our $0.02:
People that have never seen a linear schedule before usually find it easiest to read time from left to right. When meeting with executives, third party stakeholders or the Mayor, you need to bring them up to speed quick. So we plot time from left to right whenever possible.
However, certain industries and regions have been plotting time on the vertical axis for decades. In that case, stick with the format that your target audience wants to see.
(Either way, your linear schedule is sure to communicate your plan far better than that stack of Gantt charts ever could.)