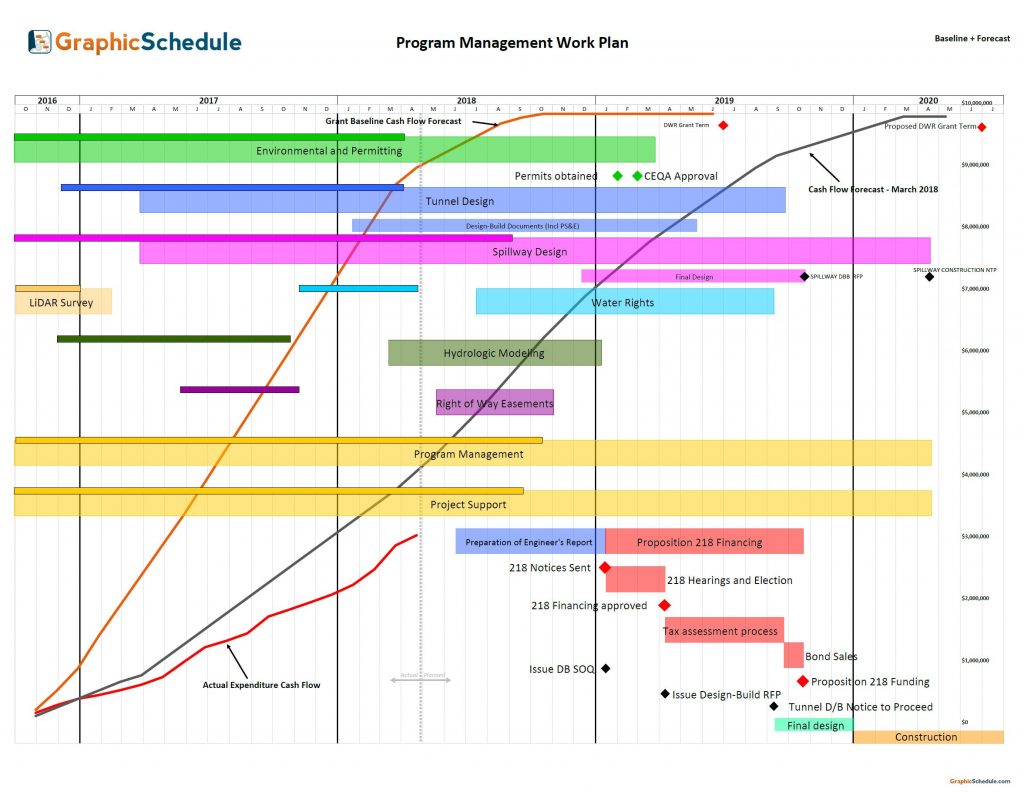
Program Management on a Single Page
Communicating schedule, cost, work status, and forecast information for the development of a new infrastructure project. Baseline and current schedules are plotted in different formats for comparison, with links to data from MS Project. The program experienced substantial delays which in turn affected the cash flow forecast, so a native Excel chart with cost curves was placed on top of the GraphicSchedule chart to show the impacts. This 1-page tool has been very effective in keeping the project team and stakeholders up to date on how this program is progressing.