Our Mission
At GraphicSchedule we empower teams to see the big picture, communicate more effectively, and deliver winning projects.
Origin Story
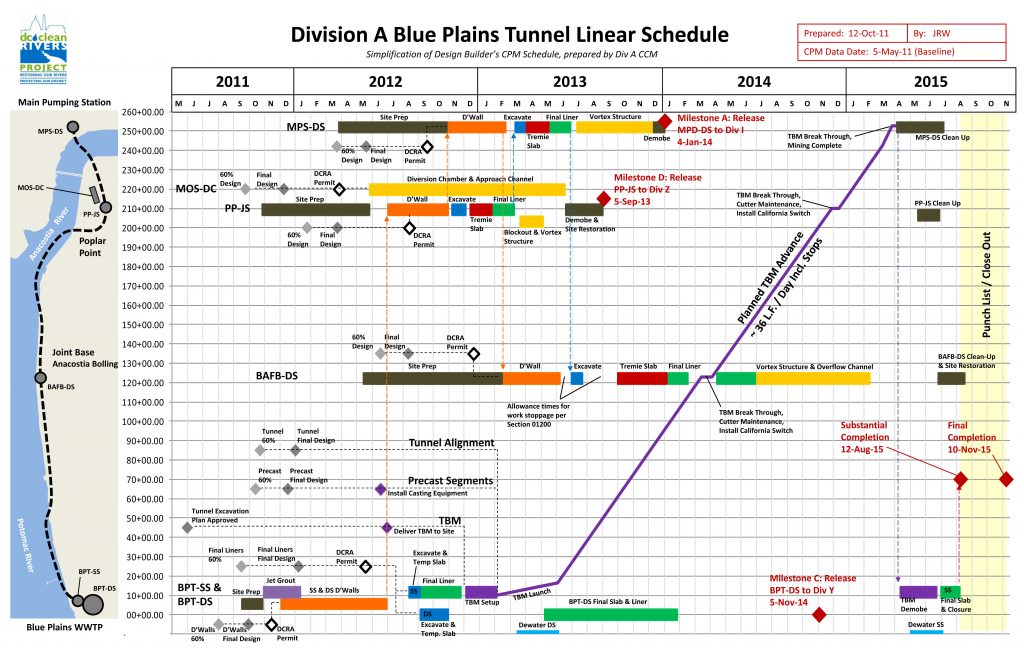
In 2011 construction managers Ron Drake and James Wonneberg faced a challenge: they needed to review a 67-page baseline schedule containing over 3,000 activities for the 5-year $330M Blue Plains Tunnel project in Washington, DC. They also needed to be able to explain this complex schedule to the rest of the team in layman’s terms.
Ron had been using 1-page linear schedules to communicate schedule understanding since the early 1990s, so he tasked James with creating one to illustrate the contractor’s Primavera P6 schedule. At this time their options were: (a) draw the linear schedule by hand and then redraw it whenever the schedule changed, or (b) purchase sophisticated software with a 400-page user manual, a steep learning curve, and an even steeper price tag. Then they had an idea:
“What if we plot our entire project on an Excel chart where X=time and Y=location, then link that chart to the contractor’s schedule data for easy updates whenever things change?“
The use of an Excel chart worked beautifully, and this linear schedule quickly became the team’s most-valuable project management tool. Monthly updates were generated in minutes, and the printouts became a fixture in cubicles and conference rooms everywhere – for designers, contractors, and construction managers alike.
Over the next few years James and Ron continued to refine their approach, and in 2015 they founded GraphicSchedule to develop an easy-to-use Excel application that the entire industry could benefit from.
As for the project, the Blue Plains Tunnel was completed successfully and received several awards, including Project of the Year from Engineering News Record. This achievement was due in large part to a proactive owner working collaboratively with world class designers and contractors towards a common goal. We like to think that the linear schedule also played a small role in helping the team get to the finish line. 😉
GraphicSchedule has come a long way since that early spreadsheet and is now in use by leading engineers, contractors, and owners seeking a better way to communicate their plan for success.
What We Believe
We believe that the vast majority of people that work on these projects really do want to know what’s in that 70-page schedule with 3,000+ activities.
They want to know the master plan. They want to see the big picture and understand the relationships between activities. They want to know about the deadlines that their crew must meet. But our industry lacks the tools to communicate that information in a way that the entire team can understand.
We believe that if you make your schedule beautiful, your team will use it!
If you place a good-looking graphic schedule on the table in any project office or jobsite trailer, people will go out of their way to look at it, pick it up, and study it. Then they will ask questions, and give you valuable feedback about how the work will actually be built.
(But if you don’t make your schedule beautiful, it will be ignored and forgotten like all the rest.)
We believe that schedules should fit on one page.
The moment you have to flip the page to see the rest of your sequence of work, you’ve lost the relationships between activities. This is not to say that we don’t create multiple sheets; in fact we do it all the time to “zoom in” and “zoom out” on our projects. But each sheet should tell the whole story of what you are trying to communicate.
We believe that adding a simple graphic of what you’re building makes your schedule information 10x more useful and effective.
Most people are visual learners, and schedule data doesn’t sink in unless they can visualize the major work elements and the spatial relationships between them. A one-page illustration of scope of work and schedule becomes a very useful “talking paper” that helps you quickly explain your entire project to anyone, anywhere. And your team members will undoubtedly start sketching right on top of it for all sorts of problem solving, alternatives, and what-if-scenarios. This is when the magic happens – increasing the chances of your team delivering a winning project.


